[Worksheet] How to Measure the Business Impact of Your Email Marketing

Research from the Direct Marketing Association has shown that email marketing returns $38 for every $1 spent.
Do you know if this return on investment rings true for your small business?
If you don’t know the answer, it’s okay, you’re not alone.
Many small business owners we talk to just aren’t that excited about digging into email marketing reports.
But when they see the connection between their email marketing activities and real business results, things start to get a lot more exciting.
Use these worksheets to tie your email marketing activities to business results.
Download your worksheets:If you’re using Constant Contact for email marketing, you’ll be able to look at the performance of your individual emails, see how well your emails perform on average, benchmark your email results to industry averages as well as against your own averages, and compare multiple email campaigns against each other.
1. How to Measure the Business Impact of Your Email Marketing — Time-Based Promotions
2. How to Measure the Business Impact of Your Email Marketing — Nonpromotional emails
But there’s another metric that doesn’t reside within your email marketing reports and that’s business result. So we’ve created some handy-dandy worksheets for you so you can get a better understanding of how your email activities are bringing real results to your business.
Use your worksheets to follow along below. We’ll walk you through how to use these worksheets to make smarter marketing decisions for your business in our free workshop: See the Impact of Your Email Marketing with Reports.
Why bother doing this exercise at all?
Beyond seeing the direct impact email marketing is having on your business, you’ll also start to identify trends allowing you to make smarter decisions about your email marketing efforts.For example, let’s say the owner of a bike shop sends a time-based promotion series of emails with a business goal to sell bikes. After filling out the worksheet with information from his email reports along with sales-related results, he notices the following:
- The announcement email had the highest open rate but only generated a few sales.
- The reminder email had a lower open rate than the announcement but also generated a few sales.
- The last chance email had the lowest open rate but generated the most sales.
By analyzing his reports, the bike shop owner, now understands the importance of sending the full series of emails. Even though, initially, he thought he might be sending too much, by filling in his worksheet he’s able to see that people often don’t take action in the first email and need to be reminded to act and buy something. So, if he only sends one email instead of three, he’s likely to be losing sales in the long run.
You can start making smarter marketing decisions too.
If you’ve been following along with our recent content, you know we cover the two types of emails you’ll typically send:- Time-based promotions
- Non-promotional emails
Let’s take a look at how to use your worksheet to help you get a sense of how email marketing is helping your business and see if there are any adjustments to be made to future emails.
You’ll see we have a separate worksheet for each of the two types of emails. You’ll follow a similar process for filling out the worksheets.
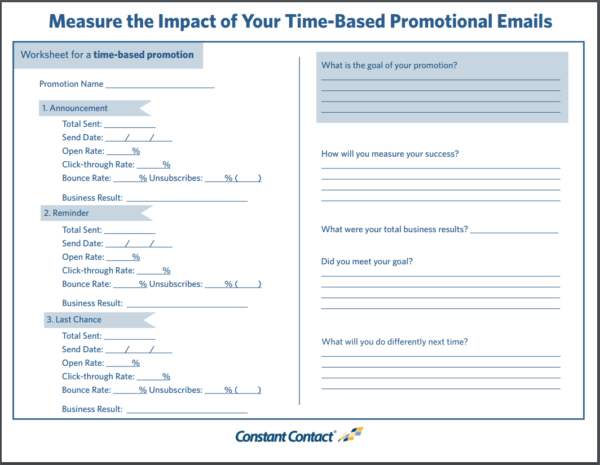
Here we’ll take a look at the worksheet for a time-based promotion.

Start by writing in the name of your promotion.
Then open up the reports section of your Constant Contact account.
Fill in the details for each of the emails you sent as part of your time-based promotion series. You should have sent three emails: An announcement, a reminder, and a last-chance email.
Look at your reports for the following:
- Total Sent: The total number of contacts you sent your email to.
- Send Date: The date you sent your email.
- Open Rate: The percentage of contacts who opened your email.
- Click-through Rate: The percentage of people who clicked on a link within your email.
- Bounce Rate: The percentage of emails that didn’t make it to the intended recipient.
- Unsubscribes: These are the people who decided to no longer receive your emails. Enter both the percentage and raw number of people.
- Business Result: Here you’ll enter the number of business actions that resulted from the email.
- For time-based promotions, this could mean things like registrations, attendance, payment status, revenue, number sold, new customers, or repeat customers.
- For non-promotional emails, beyond the email engagement, you’ll look at things like response rate, completion rate, video views, downloads, website visits, social engagement, reach, or an increase in followers.
Take a look at the right side of your worksheet.
Here’s the information you’ll find on the right side of your worksheets:- What is the goal of your promotion/email? This is where you’ll enter what you wanted people to do when they received your email. This is typically your call-to-action request.
- How will you measure your success? The answer to this question should map to your goal. If you asked people to read a blog post, you’d measure your success based on your click-through rate and visits to that particular page on your website.
- What were your total business results? This is where you’d enter the total from all the emails sent. Enter any pertinent information here, such as total number sold and total revenue. You may find this information in other systems such as Google Analytics, your point-of-sale software, or by manually tracking them.
- Did you meet your goal? Looking at your overall results, how did your campaign perform based on your expectations?
- What will you do differently next time? Jot down any ideas you have for making adjustments next time.
What are you noticing from your worksheets?
We already mentioned how the bike shop owner noticed how the time-based promotion email series impacts his sales. You may also notice things like high email engagement but low sales. This could indicate that you should look at your offer. Is it the right offer? Is there something in the sales flow stopping people?Of course, there’s much more you can uncover.
Comments
Post a Comment